Measured
649,650,000 acres
Modeled available acreage from selected land-use shares
Average American: Habitable Land and Housing Allocation Explorer
Compare standardized private and shared living-space assumptions against USDA land-use categories. The model separates total land from urban, residential, buildable, and realistically available land.
Scenario calculator
Simple logic explanation:
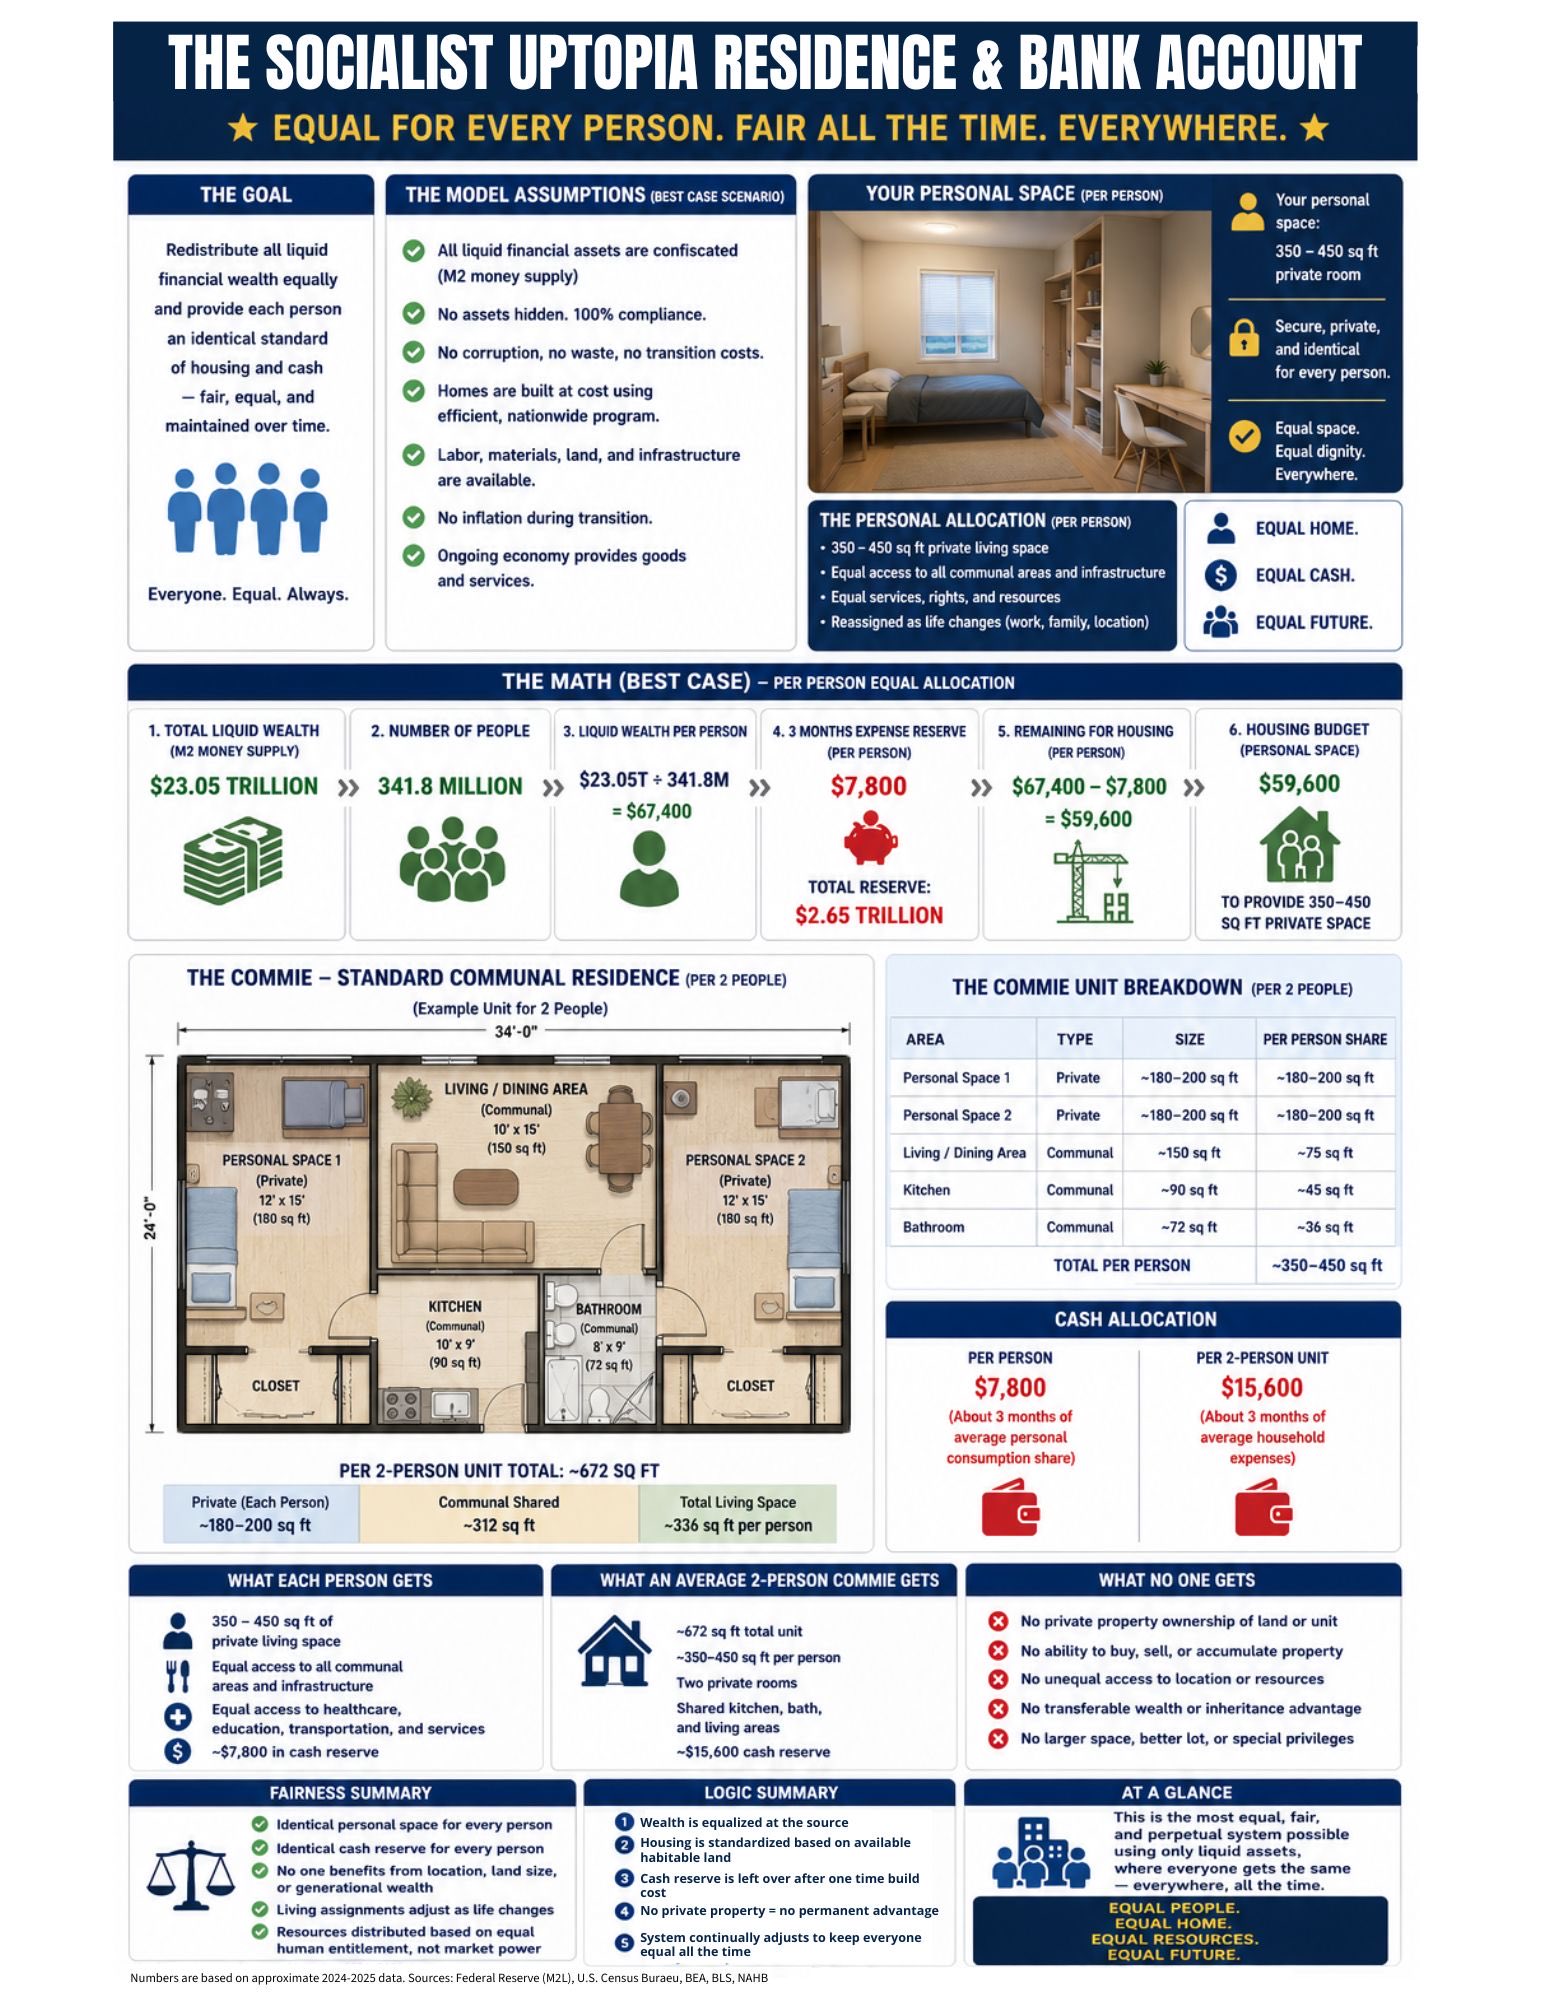
This top section follows the specific redistribution scenario: divide M2, reserve three months of cash, then test what kind of standardized residence the remaining housing budget could theoretically support.
The 350-450 sq ft range is total assigned residential space per person, not entirely private space. It includes a private sleeping/living area plus each resident's proportional share of kitchens, bathrooms, halls, laundry, mechanical space, and common living areas.
This model is intentionally favorable to redistribution.
These assumptions are unrealistic, but they frame the best-case scenario given available money supply and construction provided at cost without profit.
Federal Reserve / FRED M2SL
$67,447 per person before reserve
Census population estimate
341,784,857 people
Census household characteristics
2.53 persons per household
BLS Consumer Expenditures
$78,535 per consumer unit
Construction cost assumption
$150 per sq ft model input
Modeled housing budget
$59,686 per person after reserve
At $150 per sq ft, the modeled budget supports 398 sq ft of total residential space per person. The default two-person unit is 694 sq ft and costs $104.1K against a $119.4K M2-funded unit budget.
Broader land explorer
These controls move from the specific unit design to national land pressure: selected acreage assumptions, density model, land-use categories, and total acreage required.
Measured
649,650,000 acres
Modeled available acreage from selected land-use shares
Measured
341,784,857
Estimated total population
Calculated
82,797 sq ft
Best-case sq ft per person before practical constraints
Calculated
907,555 acres
0.1% of selected available acreage
Land model controls
Land-use availability
Select what share of each USDA land-use category could theoretically be used before applying the housing-density model.
Grassland/range
Grassland pasture and rangeland.
50.0%
329,500,000 acres
Forest-use land
Forest-use land.
30.0%
186,600,000 acres
Cropland
Cropland.
10.0%
39,000,000 acres
Special uses
Primarily parks, wildlife areas, transportation, and defense uses.
15.0%
47,700,000 acres
Miscellaneous
Wetlands, tundra, deserts, and other miscellaneous uses.
5.0%
9,850,000 acres
Urban land
Urban land. This is not all residential or available for housing.
50.0%
37,000,000 acres
Selected available land: 649,650,000 acres
The default mix is intentionally conservative: it keeps most cropland, special-use land, and miscellaneous land out of the housing pool while allowing users to test broader or narrower assumptions.
Land-use context
Urban land is only one category, and it includes commercial, industrial, roads, public facilities, and existing housing. It is not the same as vacant residential land.
Grassland/range: 659,000,000 acres
Forest-use land: 622,000,000 acres
Cropland: 390,000,000 acres
Special uses: 318,000,000 acres
Miscellaneous: 197,000,000 acres
Urban land: 74,000,000 acres
Modeled readout
Density sensitivity
Strict equality logic
Existing baseline
Scenario limitation
Source notes