Medicaid / CHIP
Budget input: $950B
Recipients: 77,300,000 (22.6% of population)
39.4% also receive SNAP, 22.5% free/reduced lunch, 2.8% TANF, and about 12% rental or energy aid.
Average American: Welfare Demographics Explorer
Explore Census data on program participation, demographics, and social safety net benefits using the official interactive visualization.
Official source
This page embeds the U.S. Census Bureau visualization for social safety net participation from the Survey of Income and Program Participation. It is a source explorer, not an Average-American.net calculation.
Open the original Census visualization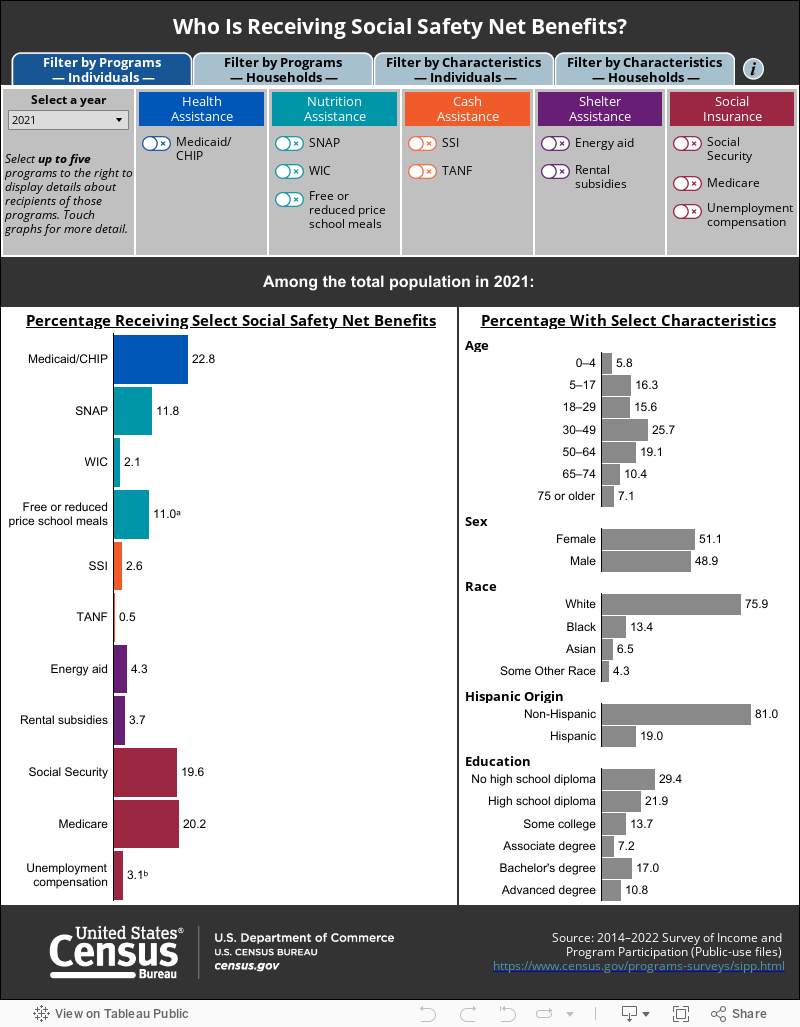
Comparable current welfare snapshot
Considering Medicaid/CHIP, SNAP, free/reduced lunch, TANF, rental, and energy social welfare programs, we estimate about 92,000,000 unduplicated recipients. The listed program counts overlap, so this is not the sum of all participants.
Lower bound
~85M people on Medicaid/CHIP or SNAP after subtracting their overlap.
Default estimate
~92M people after adding school meals, TANF, rental, and energy aid with overlap adjustments.
High estimate
~100M people allowing more non-overlap across school meals, rental, and energy aid.
Total budget estimate
$1.2T
Estimated recipients
92,000,000
26.9% of population
Annual assistance equivalent
$13,043
per person per year
Medicaid / CHIP
Budget input: $950B
Recipients: 77,300,000 (22.6% of population)
39.4% also receive SNAP, 22.5% free/reduced lunch, 2.8% TANF, and about 12% rental or energy aid.
SNAP
Budget input: $113B
Recipients: 38,300,000 (11.2% of population)
79.5% also receive Medicaid/CHIP, 22.8% free/reduced lunch, 4.5% TANF, and 20% rental or energy aid.
Free / reduced school meals
Budget input: $21B
Recipients: 28,800,000 (8.4% of population)
60.5% also receive Medicaid/CHIP, 30.3% SNAP, 4.1% TANF, and 8.5% rental or energy aid.
TANF
Budget input: $17B
Recipients: 2,400,000 (0.7% of population)
88% also receive Medicaid/CHIP, 70.1% SNAP, 47.7% free/reduced lunch, and 30% rental or energy aid.
Rental subsidies
Budget input: $70B
Recipients: 11,700,000 (3.4% of population)
77.4% also receive Medicaid/CHIP, 65.1% SNAP, 20.4% free/reduced lunch, 6.3% TANF, and 28.5% energy aid.
Energy aid
Budget input: $4B
Recipients: 14,400,000 (4.2% of population)
65.8% also receive Medicaid/CHIP, 54.4% SNAP, 4.8% TANF, and 23.2% rental subsidies.