Featured investigation / November 5, 2026

America at a Crossroads: Tracking the Real Cost of Policy Changes

A sourced baseline for the 2026 congressional shift: immigration, prices, housing, education, healthcare, crime and local budgets, with a public scorecard to distinguish proposals from implemented policy and correlation from cause.

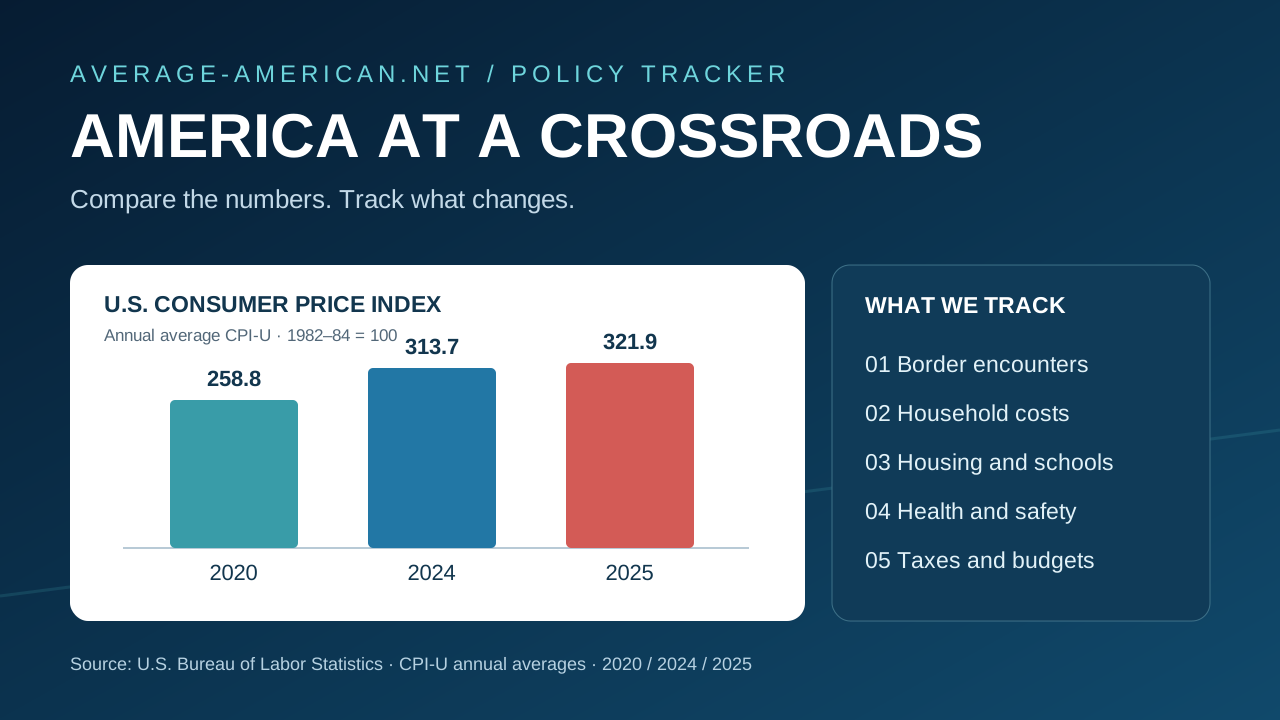
America at a Crossroads infographic comparing CPI-U annual averages: 258.8 in 2020, 313.7 in 2024 and 321.9 in 2025, with five public-policy tracking areas.

Original data graphic · BLS CPI-U

Open the calculator scenario

Question

How did key American-life indicators change under Biden and Trump, and what should we track after the 2026 elections?

Claim being tested

Federal policy shifted across administrations, but observed changes in border encounters, prices, housing and services cannot be assigned to one administration without considering timing and other causes.

The 2026 elections give Democrats control of the next Congress, not the presidency. This tracker compares observable indicators across administrations, then measures what changes after specific policies take effect. The first verified baselines show major changes in border encounters and consumer prices, but neither metric alone proves a single cause.

Fact-based response

What the data actually show

POLITICAL STARTING POINT — Democrats won control of the House and Senate in the November 2026 midterms. President Trump remains in office. The new Congress convenes in January 2027, so election results are not themselves changes in immigration, spending, policing or tax law. We will log proposed legislation, enactment dates, executive actions, appropriations and judicial decisions separately.

COMPETING COVERAGE — The Wall Street Journal emphasizes Democrats’ unified affordability message and election gains; Al Jazeera emphasizes the obstacles to turning those promises into law while President Trump retains veto power. Both are interpretive news coverage, not substitutes for the government data below. Their different frames help establish what the tracker should test.

IMMIGRATION AND ENFORCEMENT — CBP recorded about 1.73 million encounters along the southwest land border in fiscal 2021 and about 2.1 million in fiscal 2024, according to GAO's review of CBP data. CBP's first ten months of fiscal 2025 totaled 422,325. These are encounter events, not unique migrants admitted, residents settled or a count of people using public services. Fiscal years overlap presidential terms; monthly data and policy effective dates are needed for attribution.

Source data comparison

U.S. consumer price index, annual average

Published source data
X-axis: Calendar year
Y-axis: CPI-U (1982–84 = 100)
U.S. consumer price index, annual average. BLS CPI-U annual averages; not inflation-adjusted dollars. Calendar years are not identical to presidential terms.
Categoryindex
2020258.811 index
2024313.689 index
2025321.943 index

BLS CPI-U annual averages; not inflation-adjusted dollars. Calendar years are not identical to presidential terms.

HOUSEHOLD PRICES — BLS annual-average CPI-U was 258.811 in 2020, 313.689 in 2024 and 321.943 in 2025 (1982–84=100). The overall price level rose about 21.2% between the 2020 and 2024 annual averages, then about 2.6% between 2024 and 2025. Annual averages describe calendar years, not inauguration-to-inauguration performance; inflation has multiple causes including supply shocks, monetary policy and energy prices.

Source data comparison

Southwest border encounters: different reporting periods

Published source data
X-axis: Fiscal reporting period
Y-axis: Encounter events
Southwest border encounters: different reporting periods. GAO/CBP. FY2025 covers only its first ten months and must not be compared as if it were a complete fiscal year. Encounters are events, not unique people admitted.
Categoryevents
FY20211,730,000 events
FY20242,100,000 events
FY2025 Oct–Jul422,325 events

GAO/CBP. FY2025 covers only its first ten months and must not be compared as if it were a complete fiscal year. Encounters are events, not unique people admitted.

WHAT THE TWO CHARTS SHOW — The first chart compares annual-average consumer price index levels in 2020, 2024 and 2025. The second compares southwest border encounter events in fiscal 2021, fiscal 2024 and the first ten months of fiscal 2025. The 2025 border figure is a partial-year total and must not be treated as a full-year comparison.

HOUSING AND LOCAL CAPACITY — Census QuickFacts reports a national median gross rent of $1,413 for the 2020–2024 American Community Survey period. This is a five-year estimate, not a 2024 point-in-time rent. Housing demand, construction, zoning, household formation, interest rates and migration can all affect rents; local supply and neighborhood-level comparisons will be essential.

EDUCATION AND HEALTHCARE — We will track public-school enrollment, English-learner counts, inflation-adjusted spending per pupil, emergency-department utilization, uncompensated care and insurance coverage. These series often lag. An increase in enrollment or cost is not automatically an immigration effect, and costs must be assessed alongside tax receipts and federal/state reimbursements.

CRIME AND PUBLIC SAFETY — We will track FBI-reported offenses and victimization measures per 100,000 residents, reporting coverage, staffing and local enforcement budgets. We will not infer that immigrants caused crime-rate changes from national trend lines or from changes in the number of border encounters.

TAXES AND PUBLIC BUDGETS — We will compare inflation-adjusted per-capita federal, state and local revenues, spending, deficits and service workloads. A change in federal leadership does not immediately change city or school-district budgets, and fiscal-year comparisons need to account for pandemic programs and population growth.

TRACKER RULES — Each future update will record the metric, geographic area, denominator, source release date, policy effective date, comparison period and limitations. Where evidence supports a causal estimate, we will report it; where it does not, we will label the result as correlation or an open question. The goal is to test predictions rather than assume a predetermined outcome.

CASE STUDY — New York City's rent-stabilization freeze remains in our research archive as a separate case study. We will monitor operating expenses, net operating income, deferred maintenance, violations and housing supply while separating projections from observed outcomes.