Research investigation / October 31, 2026

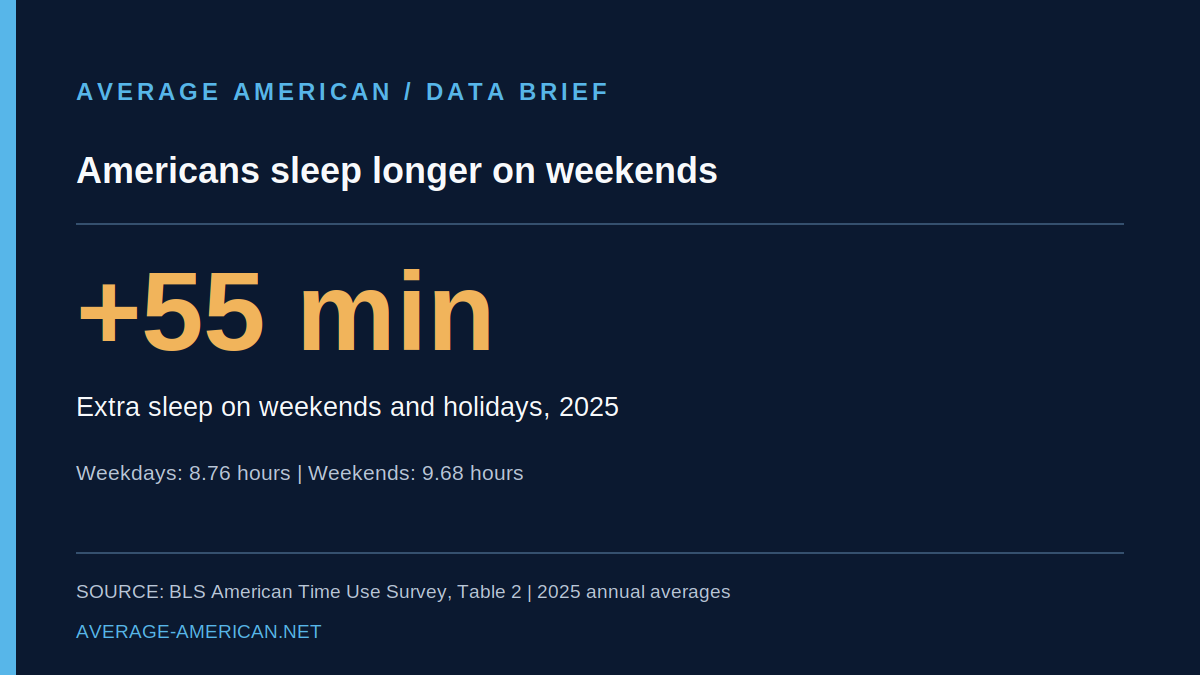
Americans logged about 55 more minutes of sleep on weekends in 2025

The Bureau of Labor Statistics' 2025 American Time Use Survey reports an average of 8.76 hours in the sleeping category on weekdays and 9.68 hours on weekends and holidays for people age 15 and older. The 0.92-hour difference equals 55.2 minutes. The survey category includes naps and spells of sleeplessness, and these are population averages, not advice on how long to sleep.

Americans logged about 55 more minutes of sleep on weekends in 2025 infographic

Research visual

Read the research

Question

How much longer did Americans spend sleeping on weekends and holidays than on weekdays in 2025?

Claim being tested

In 2025, Americans age 15 and older averaged 8.76 hours per weekday and 9.68 hours per weekend or holiday in the ATUS sleeping category, a difference of about 55 minutes.

In 2025, Americans age 15 and older averaged 8.76 hours per weekday and 9.68 hours per weekend or holiday in the ATUS sleeping category, a difference of about 55 minutes.

Competing story frames

Fact-based response

What the data actually show

The U.S. Bureau of Labor Statistics' 2025 American Time Use Survey (ATUS) asked a nationally representative sample of people age 15 and older to report how they spent the previous day. Table 2 separates Monday-through-Friday weekdays (excluding holidays) from Saturdays, Sundays, and specified holidays. The figures describe average time in an activity across the surveyed population, not a nightly sleep recommendation.

Table 2 reports 8.76 hours in the sleeping category on an average weekday and 9.68 hours on an average weekend day or holiday. Subtracting gives 0.92 hour. Multiplying by 60 gives 55.2 minutes, rounded to 55 minutes in the headline. The first chart compares the two published averages directly.

Source data comparison

Sleeping-category hours by day type

Published source data
X-axis: Day type
Y-axis: Hours per person per day
Sleeping-category hours by day type. BLS ATUS 2025 Table 2, population age 15+. Weekends include specified holidays. Sleeping includes naps and spells of sleeplessness.
Categoryhours
Weekdays8.76 hours
Weekends & holidays9.68 hours

BLS ATUS 2025 Table 2, population age 15+. Weekends include specified holidays. Sleeping includes naps and spells of sleeplessness.

The difference is a comparison between population averages for different day types. It does not mean that every person sleeps 55 minutes longer on weekends. Work schedules, school schedules, ages, and other characteristics differ across the population. The ATUS diary records activities over a 24-hour period rather than tracking the same person's sleep across an entire week.

The BLS defines its sleeping category broadly: it includes naps and spells of sleeplessness. Accordingly, these figures should not be interpreted as uninterrupted nighttime sleep or as proof of sleep quality. The survey also covers people who are employed and people who are not employed.

Across all days of the week, Table 1 reports 9.03 hours per day in the sleeping category. The same table reports 8.93 hours for men and 9.13 hours for women, a 0.20-hour or 12-minute difference between the published sex-specific averages. The second chart shows this separate all-days comparison; it does not adjust for other differences in the groups.

Source data comparison

All-days sleeping averages by sex

Published source data
X-axis: Sex
Y-axis: Hours per person per day
All-days sleeping averages by sex. BLS ATUS 2025 Table 1, population age 15+. All days combined. The 0.20-hour difference equals 12 minutes; no adjustment for other characteristics.
Categoryhours
Men8.93 hours
Women9.13 hours

BLS ATUS 2025 Table 1, population age 15+. All days combined. The 0.20-hour difference equals 12 minutes; no adjustment for other characteristics.

BLS conducted approximately 6,100 ATUS interviews in 2025. Survey estimates are subject to sampling and nonsampling error. They describe population-level patterns, not what an individual needs for health or why one group reports more time in a category.

To reproduce the headline, use BLS Table 2: (9.68 - 8.76) × 60 = 55.2 minutes. For the second chart, use Table 1: (9.13 - 8.93) × 60 = 12 minutes. The original BLS tables and technical note are linked below.