Research investigation / October 23, 2026

The American Commute: 227 Hours a Year Just Getting to Work

The Census reports a 27.2-minute average one-way commute in 2024. We translate that into annual hours, examine the long-commute minority, and show how working from home changes the picture.

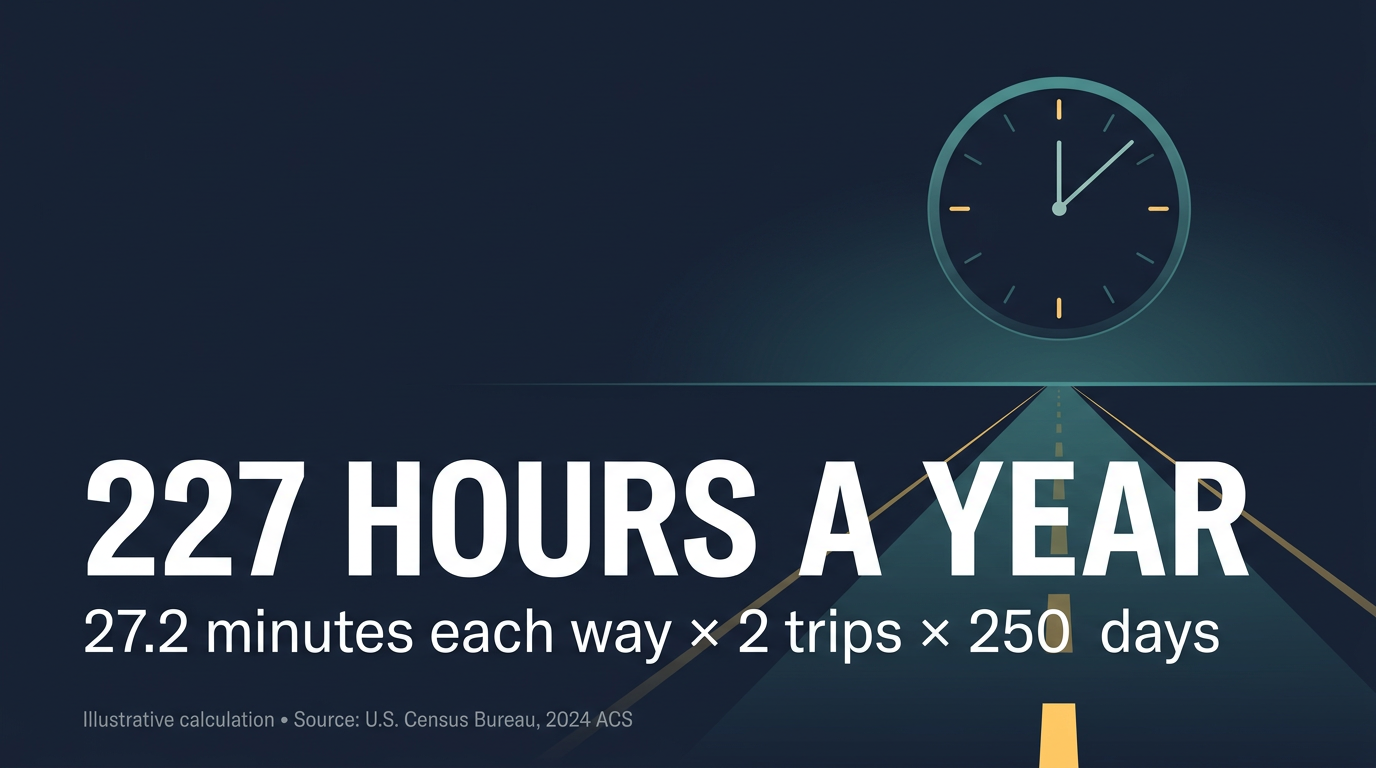
Editorial graphic showing 227 hours a year as an illustrative annual commute calculation based on Census 2024 mean one-way travel time and 250 commuting days.

Annual commute time | Census ACS + illustrative calculation

Read the research

Question

How much time does the average American commuter spend traveling to work—and what does the national average hide?

Claim being tested

The 2024 national mean one-way commute was 27.2 minutes. At 250 round-trip commuting days, that represents approximately 227 hours a year. Meanwhile, 9.3% of commuters traveled at least 60 minutes one way.

According to the U.S. Census Bureau's American Community Survey, the mean one-way commute increased from 26.8 minutes in 2023 to 27.2 minutes in 2024. Assuming 250 commuting days and a return trip of the same duration, that is 226.7 hours annually—9.4 full 24-hour days. This is an illustrative calculation, not a Census estimate of actual annual hours.

Competing story frames

Fact-based response

What the data actually show

THE NATIONAL TREND — The mean one-way commute increased by 0.4 minutes, or 24 seconds, between 2023 and 2024. The 2019 pre-pandemic mean was 27.6 minutes, so 2024 remained slightly below that level. The national mean alone cannot establish why travel time changed.

THE ANNUAL TIME COST — 27.2 minutes × 2 trips × 250 commuting days ÷ 60 = 226.7 hours. That's about 9.4 full 24-hour days, or 28.3 eight-hour workdays. This scenario assumes a comparable return trip and 250 days of travel; real schedules, hybrid work, traffic, and time off differ.

THE LONG-COMMUTE GROUP — The share of commuting workers traveling at least 60 minutes one way rose from 8.9% in 2023 to 9.3% in 2024. At exactly one hour each way for 250 days, a commuter spends 500 hours annually traveling—more than 20 full days. Workers above the one-hour threshold could spend more.

WORKING FROM HOME — 13.3% of workers worked from home in 2024, down from 13.8% in 2023. The ACS travel-time average is calculated for workers who did not work from home, so it should not be described as the average for every employed American.

HOW AMERICANS TRAVELED — 69.2% of workers drove alone in both 2023 and 2024. Public transit's share increased from 3.5% to 3.7%. Different modes and geographies can have very different travel times, which the national mean masks.

WHAT THE DATA DO NOT PROVE — These descriptive estimates do not prove that commuting has become less affordable, that employers caused the change, or that any single policy is responsible. Annualized hours here are scenario calculations, not direct ACS survey results.

METHODOLOGY — Census statistics come from 2023 and 2024 ACS 1-year Table S0801 and the Census Bureau's commuting indicators. The ACS defines mean travel time as the usual one-way home-to-work trip for workers age 16+ who did not work from home. Estimates are rounded; 2020 is omitted from the standard 1-year trend due to pandemic-related collection limitations.

Recommended visual

bar chartVisual brief

How much time does the average commute take?

The national mean rose from 26.8 minutes in 2023 to 27.2 in 2024.

Data needed: Census ACS 1-year S0801 mean travel time to work for 2023 and 2024.
Placement: Fact-based response

Source data comparison

Average one-way commute, United States

Published source data
X-axis: Survey year
Y-axis: Minutes
Average one-way commute, United States. Source: U.S. Census Bureau, ACS 1-year estimates, S0801. Annualized 227 hours is an illustrative calculation assuming 250 round trips.
Categorymin
202326.8 min
202427.2 min

Source: U.S. Census Bureau, ACS 1-year estimates, S0801. Annualized 227 hours is an illustrative calculation assuming 250 round trips.