Research investigation / November 4, 2026

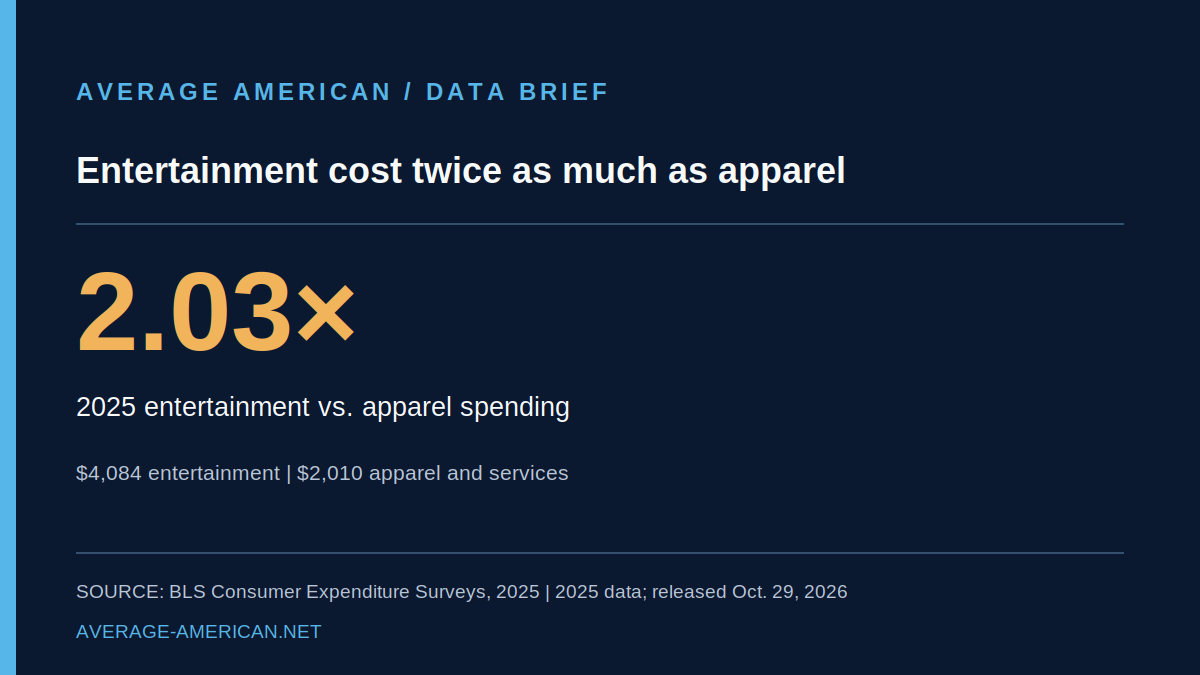
U.S. consumer units spent about twice as much on entertainment as apparel in 2025

BLS 2025 Consumer Expenditure Surveys show average annual entertainment spending of $4,084 per consumer unit, compared with $2,010 for apparel and services. The difference was $2,074, or about 2.03 times as much. These are averages across consumer units, not individual spending totals.

U.S. consumer units spent about twice as much on entertainment as apparel in 2025 infographic

Research visual

Read the research

Question

How did average entertainment and apparel spending compare in 2025?

Claim being tested

Average U.S. consumer-unit entertainment expenditures in 2025 were about twice apparel and services expenditures.

Average U.S. consumer-unit entertainment expenditures in 2025 were about twice apparel and services expenditures.

Competing story frames

Fact-based response

What the data actually show

The U.S. Bureau of Labor Statistics published its 2025 Consumer Expenditure Surveys on October 29, 2026. Its national averages show $4,084 spent on entertainment and $2,010 on apparel and services per consumer unit in 2025.

The difference is $4,084 minus $2,010, or $2,074. The ratio is 4,084 divided by 2,010 = 2.032, approximately 2.03 times. Both categories are broad and cover more than a single product or activity.

Source data comparison

Entertainment versus apparel spending in 2025

Published source data
X-axis: Expenditure category
Y-axis: Average annual spending (USD)
Entertainment versus apparel spending in 2025. BLS 2025 Consumer Expenditure Surveys. Values are annual means per consumer unit, not per person.
CategoryUSD per consumer unit
Entertainment4,084 USD per consumer unit
Apparel and services2,010 USD per consumer unit

BLS 2025 Consumer Expenditure Surveys. Values are annual means per consumer unit, not per person.

For comparison, the 2024 estimates were $3,609 for entertainment and $2,001 for apparel and services. In 2025 the respective amounts were $4,084 and $2,010. These figures are current-dollar averages; they are not adjusted for inflation.

Entertainment spending includes categories such as fees and admissions, audio and visual equipment and services, pets, toys, hobbies, and other entertainment items. Apparel and services includes clothing, footwear, and related services. The categories should not be interpreted as only streaming subscriptions versus clothing purchases.

Source data comparison

Entertainment and apparel spending, 2024 and 2025

Published source data
X-axis: Year and category
Y-axis: Average annual spending (USD)
Entertainment and apparel spending, 2024 and 2025. BLS Consumer Expenditure Surveys, 2025 Table 1. Nominal dollars, not inflation-adjusted; year-to-year differences are descriptive.
CategoryUSD per consumer unit
2024 entertainment3,609 USD per consumer unit
2024 apparel2,001 USD per consumer unit
2025 entertainment4,084 USD per consumer unit
2025 apparel2,010 USD per consumer unit

BLS Consumer Expenditure Surveys, 2025 Table 1. Nominal dollars, not inflation-adjusted; year-to-year differences are descriptive.

A consumer unit can be a family, a financially independent individual, or people sharing major expenses. The averages include units with no expenditure in a given category and should not be presented as per-person spending.

BLS notes that 2025 Consumer Expenditure Survey collection was interrupted during October and November 2025, and weights were adjusted. These descriptive comparisons do not demonstrate the statistical significance of any year-to-year change.

The first chart compares 2025 spending categories in dollars. The second shows the 2024 and 2025 values for both categories. All plotted values are BLS published national means, not estimates of a typical family's budget.