Research investigation / November 1, 2026

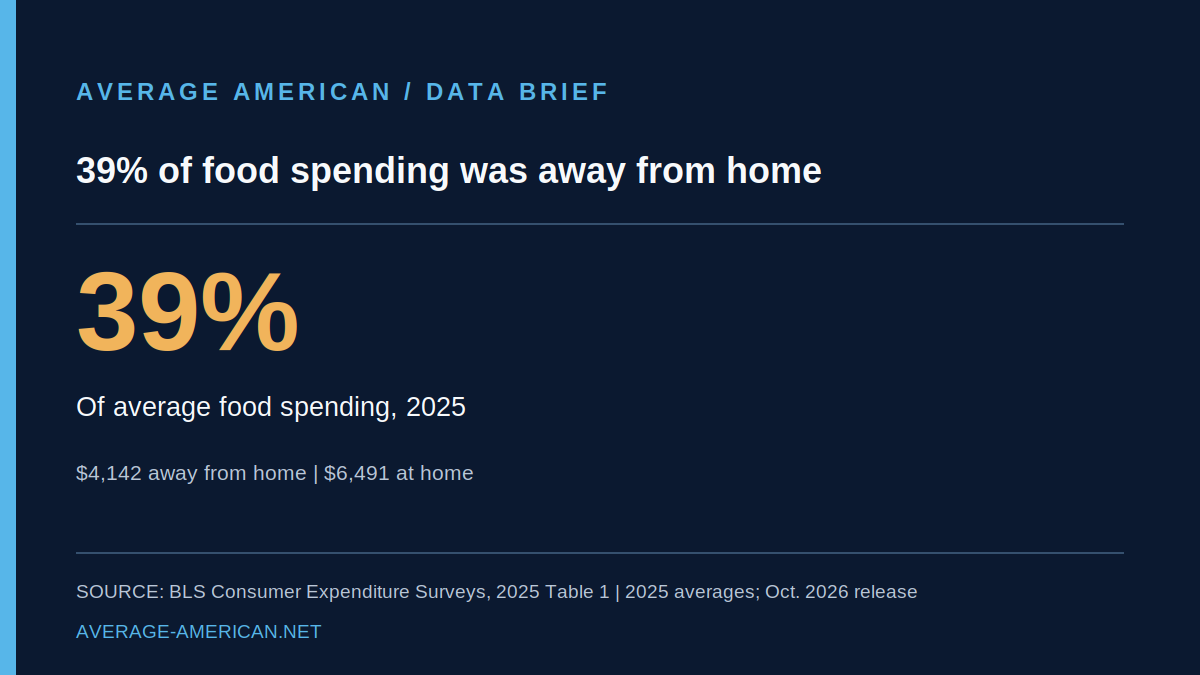
Nearly 39% of average U.S. food spending was away from home in 2025

New Bureau of Labor Statistics Consumer Expenditure Surveys data show that the average U.S. consumer unit spent $4,142 on food away from home and $6,491 on food at home in 2025. Food away from home represented 38.95% of the $10,633 total food budget, or nearly 39%. The averages cover consumer units rather than individual people, and the survey adjusted for interrupted data collection in late 2025.

Nearly 39% of average U.S. food spending was away from home in 2025 infographic

Research visual

Read the research

Question

How much of the average U.S. food budget went to restaurants, takeout, and other food away from home in 2025?

Claim being tested

In 2025, food away from home accounted for approximately 39% of average annual food expenditures per U.S. consumer unit: $4,142 of $10,633, according to the Bureau of Labor Statistics.

In 2025, food away from home accounted for approximately 39% of average annual food expenditures per U.S. consumer unit: $4,142 of $10,633, according to the Bureau of Labor Statistics.

Competing story frames

Fact-based response

What the data actually show

The U.S. Bureau of Labor Statistics released its Consumer Expenditure Surveys results for 2025 on October 29, 2026. Table 1 reports average annual food expenditures of $10,633 per consumer unit. Of that total, $6,491 was classified as food at home and $4,142 as food away from home. The first chart displays the two categories using the published dollar averages.

Dividing the food-away-from-home amount by the total food amount gives $4,142 / $10,633 = 0.3895, or about 38.95%. Rounded to the nearest whole percent, that is 39% of food spending. The remaining approximately 61.05% was food at home. These are shares of dollars spent, not shares of meals eaten or days spent dining out.

Source data comparison

Where the average U.S. food budget went in 2025

Published source data
X-axis: Food category
Y-axis: Average annual spending (USD)
Where the average U.S. food budget went in 2025. BLS Consumer Expenditure Surveys, 2025 Table 1. Averages per consumer unit, not per person. Food away from home is 38.95% of the $10,633 total.
CategoryUSD per consumer unit
Food at home6,491 USD per consumer unit
Food away from home4,142 USD per consumer unit

BLS Consumer Expenditure Surveys, 2025 Table 1. Averages per consumer unit, not per person. Food away from home is 38.95% of the $10,633 total.

The BLS term consumer unit is not the same as one person. It can describe a family, an individual making independent spending decisions, or people who pool their income to pay major expenses. The survey averages combine units of different sizes and income levels. A figure of $4,142 per consumer unit is not a per-person restaurant bill.

Food away from home includes restaurant and similar prepared-food purchases, including takeout and delivery. It is broader than sit-down dining. Food at home generally covers food bought at grocery stores and similar venues for home preparation. Alcoholic beverages are reported as a separate spending category in the BLS release.

For context, the same BLS table reports $6,224 spent on food at home and $3,945 away from home in 2024, compared with $6,491 and $4,142 in 2025. The second chart shows those published annual averages. The 2025 away-from-home figure equals approximately $79.65 per week if divided by 52, but that weekly number is an illustrative average rather than a weekly survey measurement.

Source data comparison

Average annual food spending by category, 2024 and 2025

Published source data
X-axis: Year and category
Y-axis: Average annual spending (USD)
Average annual food spending by category, 2024 and 2025. BLS Consumer Expenditure Surveys, Table 1, 2024 and 2025. Nominal dollars; individual subcategory changes were not marked statistically significant.
CategoryUSD per consumer unit
2024 food at home6,224 USD per consumer unit
2025 food at home6,491 USD per consumer unit
2024 food away3,945 USD per consumer unit
2025 food away4,142 USD per consumer unit

BLS Consumer Expenditure Surveys, Table 1, 2024 and 2025. Nominal dollars; individual subcategory changes were not marked statistically significant.

The food-away-from-home average increased by $197 from 2024 to 2025, and the food-at-home average increased by $267. These are nominal dollar differences, not inflation-adjusted changes. BLS does not mark the individual 2024-to-2025 changes in these two subcategories as statistically significant in Table 1; this article does not interpret them as proven changes in household behavior.

BLS also reports that collection of the Consumer Expenditure Surveys was interrupted in October and November 2025 during a lapse in federal appropriations. BLS applied a weighting adjustment to account for missing data and resumed collection in December. That limitation is important when interpreting 2025 estimates.

To reproduce the headline: 4,142 ÷ 10,633 × 100 = 38.95%, which rounds to 39%. To reproduce the comparison chart, use the 2024 and 2025 values for food at home and food away from home in Table 1 of the BLS release. Survey methodology, consumer-unit definitions, and source tables are linked below.