Research investigation / November 3, 2026

Health insurance accounted for two-thirds of consumer healthcare spending in 2025

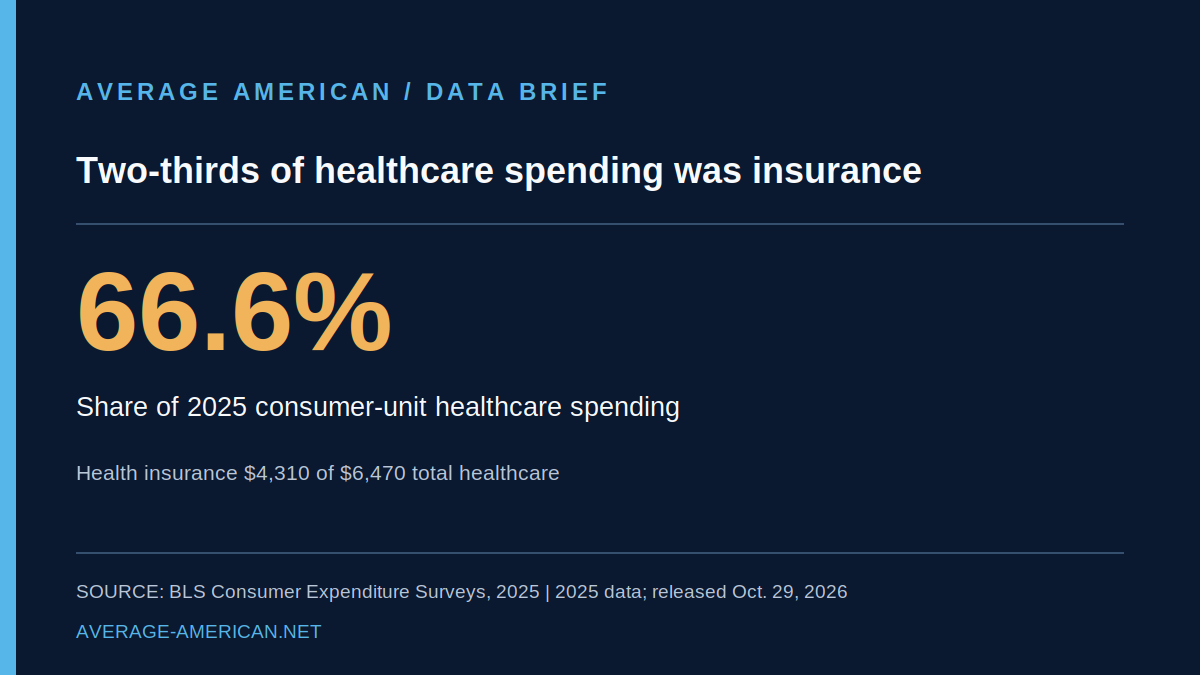
In the 2025 Consumer Expenditure Surveys, health insurance made up 66.6% of the $6,470 average annual healthcare spending reported per U.S. consumer unit. The other $2,160 covered medical services, drugs, and medical supplies. These are household spending averages, not total U.S. healthcare costs.

Health insurance accounted for two-thirds of consumer healthcare spending in 2025 infographic

Research visual

Read the research

Question

How much of the average American consumer unit's healthcare budget went to health insurance in 2025?

Claim being tested

BLS estimates show that health insurance represented about 66.6% of average annual healthcare spending per U.S. consumer unit in 2025.

BLS estimates show that health insurance represented about 66.6% of average annual healthcare spending per U.S. consumer unit in 2025.

Competing story frames

Fact-based response

What the data actually show

The U.S. Bureau of Labor Statistics released its 2025 Consumer Expenditure Surveys results on October 29, 2026. Table 1 reports average annual healthcare expenditures of $6,470 per consumer unit, including $4,310 in health insurance. Dividing $4,310 by $6,470 gives 66.615%, or 66.6% rounded to one decimal place.

The rest of the reported healthcare spending was $2,160, split among medical services ($1,260), drugs ($672), and medical supplies ($228). These four published components add to the $6,470 healthcare total. The first chart shows the complete breakdown in annual dollars.

Source data comparison

Average annual healthcare spending by category, 2025

Published source data
X-axis: Healthcare spending category
Y-axis: Average annual spending (USD)
Average annual healthcare spending by category, 2025. BLS Consumer Expenditure Surveys 2025, Table 1. Averages per consumer unit, not per person. All four categories sum to $6,470.
CategoryUSD per consumer unit
Health insurance4,310 USD per consumer unit
Medical services1,260 USD per consumer unit
Drugs672 USD per consumer unit
Medical supplies228 USD per consumer unit

BLS Consumer Expenditure Surveys 2025, Table 1. Averages per consumer unit, not per person. All four categories sum to $6,470.

The $4,310 insurance category is about twice the combined $2,160 spent in the other three healthcare categories. The ratio is $4,310 divided by $2,160, or approximately 2.00. That comparison describes spending categories, not how much medical care a family received or what an insurance policy covered.

BLS defines health insurance to include traditional fee-for-service plans, preferred-provider plans, health maintenance organizations, commercial Medicare supplements, and other health insurance. Medical services include hospital, physician, dental, eye-care, laboratory, and related services. Drugs and medical supplies are reported separately.

For context, the 2024 estimates were $6,197 in total healthcare spending and $4,055 in health insurance, a 65.4% insurance share. In 2025 the corresponding values were $6,470 and $4,310, or 66.6%. The second chart compares the insurance category with all other healthcare spending in both years. These descriptive shares alone do not establish that the year-to-year change was statistically significant.

Source data comparison

Insurance and other healthcare spending, 2024 versus 2025

Published source data
X-axis: Year and spending category
Y-axis: Average annual spending (USD)
Insurance and other healthcare spending, 2024 versus 2025. BLS Consumer Expenditure Surveys 2025, Table 1. Other healthcare is total healthcare minus health insurance: $2,142 in 2024 and $2,160 in 2025. Year-to-year differences are descriptive; no significance is claimed.
CategoryUSD per consumer unit
2024 health insurance4,055 USD per consumer unit
2024 other healthcare2,142 USD per consumer unit
2025 health insurance4,310 USD per consumer unit
2025 other healthcare2,160 USD per consumer unit

BLS Consumer Expenditure Surveys 2025, Table 1. Other healthcare is total healthcare minus health insurance: $2,142 in 2024 and $2,160 in 2025. Year-to-year differences are descriptive; no significance is claimed.

A consumer unit is not always a single person. It may be a family, an independently financed person, or a group sharing major expenses. The survey measures spending by these units, including those with different insurance arrangements and medical needs. It does not measure the full cost of U.S. healthcare, nor does it include every amount paid on someone's behalf by an employer, insurer, or government program.

The 2025 survey was affected by a lapse in federal appropriations: data collection stopped during October and November 2025. BLS adjusted survey weights to address the missing reports and cautions that uncertainty is higher than usual. The figures remain published survey estimates rather than exact expenses for every household.

To reproduce the headline, calculate 4,310 / 6,470 x 100 = 66.6%. The non-insurance amount is 6,470 - 4,310 = $2,160, which also equals 1,260 + 672 + 228. The charts use BLS Table 1 values and arithmetic derived from that table.