Research investigation / October 30, 2026

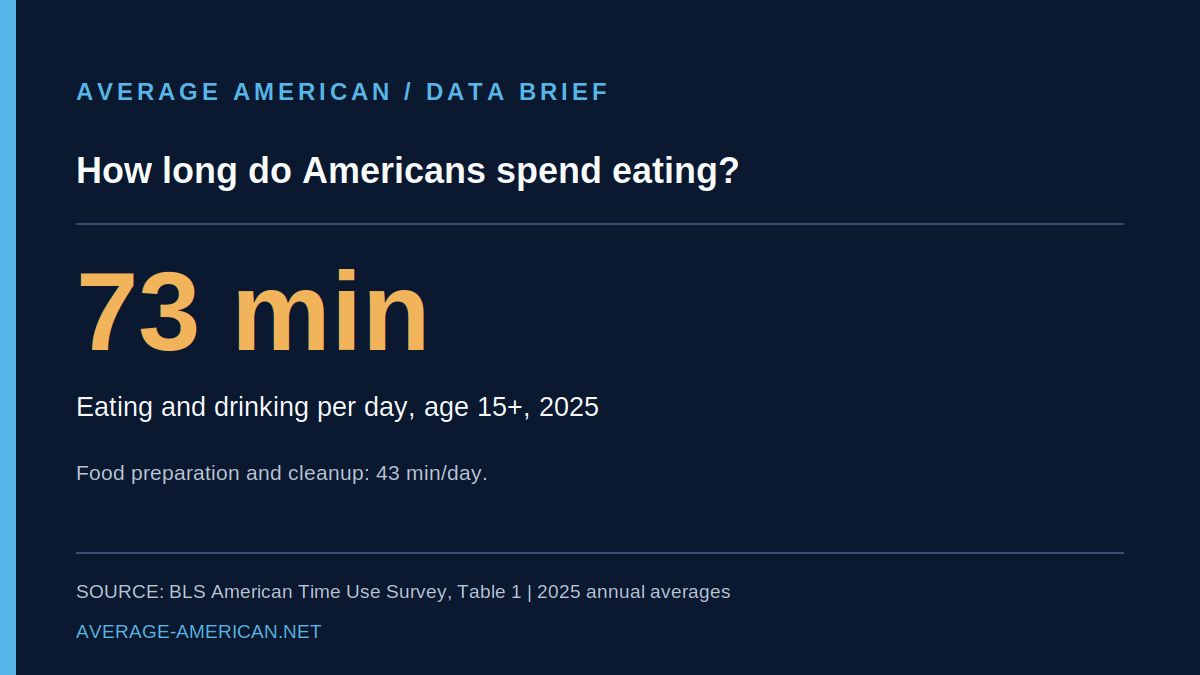
Americans spent 73 minutes a day eating in 2025, versus 43 minutes preparing food

In the 2025 American Time Use Survey, U.S. residents age 15 and older averaged 1.21 hours a day eating and drinking and 0.71 hours preparing food and cleaning up. The rounded equivalents are 73 and 43 minutes. The figures describe population-wide averages, not everyone's personal routine, and weekend eating time was higher than weekday eating time.

Americans spent 73 minutes a day eating in 2025, versus 43 minutes preparing food infographic

Research visual

Read the research

Question

How much of an average American day goes toward eating versus food preparation?

Claim being tested

In 2025, U.S. residents age 15 and older averaged 1.21 hours per day eating and drinking and 0.71 hours per day preparing food and cleaning up.

In 2025, U.S. residents age 15 and older averaged 1.21 hours per day eating and drinking and 0.71 hours per day preparing food and cleaning up.

Competing story frames

Fact-based response

What the data actually show

The Bureau of Labor Statistics' 2025 American Time Use Survey (ATUS) estimates how U.S. residents age 15 and older spent an average day. Its annual averages are based on time-use diaries, with about 6,100 interviews in 2025. These are population averages across all days and respondents, including people who did not report a given activity on their diary day.

In Table 1, eating and drinking averaged 1.21 hours per day, while food preparation and cleanup averaged 0.71 hours. Multiplying by 60 gives 72.6 minutes and 42.6 minutes, rounded to 73 and 43 in the headline. The difference is 0.50 hour, or 30 minutes per day, using the published rounded hourly estimates. The chart compares those two measured categories on the same scale.

Source data comparison

Daily eating time versus food preparation

Published source data
X-axis: Activity
Y-axis: Minutes per person per day
Daily eating time versus food preparation. BLS ATUS 2025 Table 1, U.S. civilian population age 15+. Values are 1.21 and 0.71 hours multiplied by 60; population averages include nonparticipants.
Categoryminutes
Eating & drinking72.6 minutes
Food prep & cleanup42.6 minutes

BLS ATUS 2025 Table 1, U.S. civilian population age 15+. Values are 1.21 and 0.71 hours multiplied by 60; population averages include nonparticipants.

These are different activity categories. Eating and drinking is not a count of restaurant meals, and food preparation and cleanup is not a direct measure of how often people cook at home. The survey records activities people report as their primary activity, so simultaneous or background activities are not fully captured by this comparison.

Table 2 shows eating and drinking averaged 1.16 hours (69.6 minutes) on weekdays and 1.33 hours (79.8 minutes) on weekends and holidays. Food preparation and cleanup averaged 0.70 hours (42.0 minutes) on weekdays and 0.74 hours (44.4 minutes) on weekends and holidays. The weekday-versus-weekend chart uses these BLS values, with hours converted to minutes.

Source data comparison

How the daily averages change on weekends

Published source data
X-axis: Activity and day type
Y-axis: Minutes per person per day
How the daily averages change on weekends. BLS ATUS 2025 Table 2. Weekends include holidays. Values converted from published hours to minutes; categories represent population averages.
Categoryminutes
Eating weekdays69.6 minutes
Eating weekends79.8 minutes
Prep weekdays42 minutes
Prep weekends44.4 minutes

BLS ATUS 2025 Table 2. Weekends include holidays. Values converted from published hours to minutes; categories represent population averages.

The survey also separates participation from duration. On an average day, 96.9% of respondents reported eating and drinking as a primary activity, compared with 65.2% reporting food preparation and cleanup. Among only people who engaged in each activity on their diary day, the corresponding averages were 1.25 hours for eating and 1.09 hours for food preparation. Those participant-only averages must not be confused with the all-population averages in the headline.

A 73-minute eating average does not imply that everyone spends 73 minutes at meals, and the 43-minute food-preparation average does not imply that every household cooks for 43 minutes. Different people, schedules, and activities contribute to each average. The figures describe time use, not the nutritional quality of meals, household spending, or where food was purchased.

For readers checking the math, the headline rounds 1.21 × 60 = 72.6 to 73 minutes and 0.71 × 60 = 42.6 to 43 minutes. The two charts retain the unrounded minute equivalents derived from the published two-decimal-hour BLS values. The underlying 2025 ATUS tables and technical note are linked below.