Research investigation / November 2, 2026

U.S. consumer units spent nearly twice as much on other vehicle expenses as on fuel in 2025

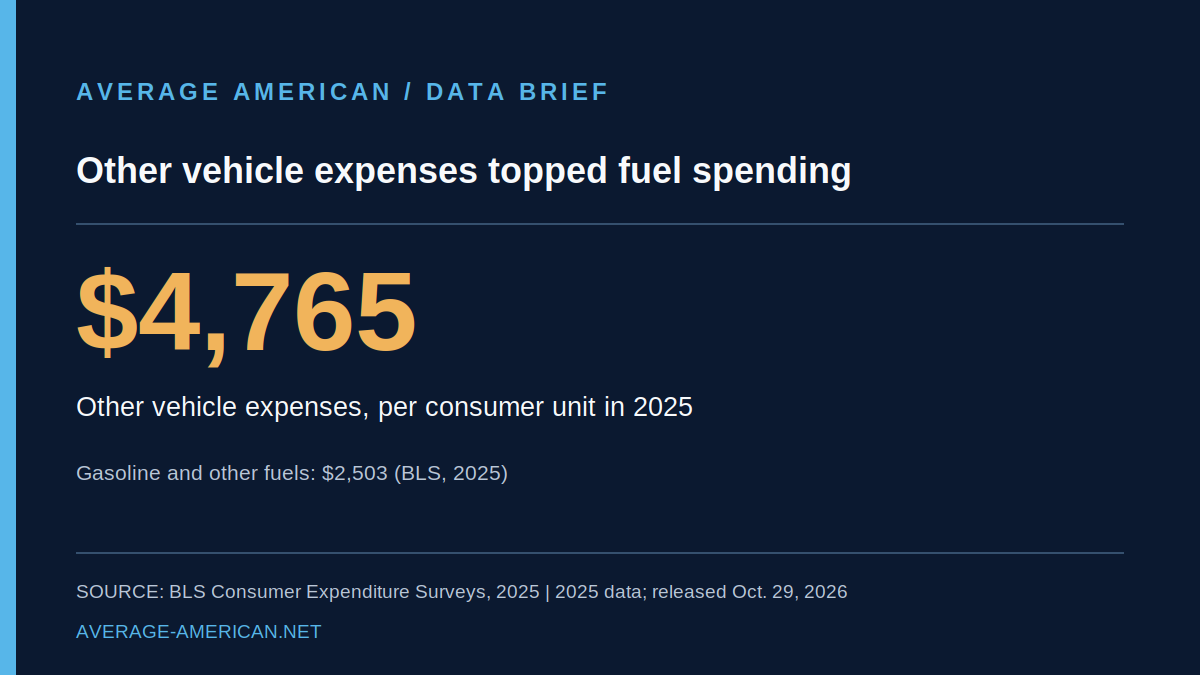
New Bureau of Labor Statistics data show that the average U.S. consumer unit spent $4,765 on other vehicle expenses in 2025, compared with $2,503 on gasoline and other fuels. The $2,262 difference is a comparison of annual spending categories, not a price increase or an estimate for each driver.

U.S. consumer units spent nearly twice as much on other vehicle expenses as on fuel in 2025 infographic

Research visual

Read the research

Question

Did Americans spend more on gasoline or on the other costs of keeping vehicles on the road in 2025?

Claim being tested

In 2025, average annual other vehicle expenses were $4,765 per U.S. consumer unit, compared with $2,503 for gasoline and other fuels, according to the Bureau of Labor Statistics Consumer Expenditure Surveys.

In 2025, average annual other vehicle expenses were $4,765 per U.S. consumer unit, compared with $2,503 for gasoline and other fuels, according to the Bureau of Labor Statistics Consumer Expenditure Surveys.

Competing story frames

Fact-based response

What the data actually show

The U.S. Bureau of Labor Statistics released its 2025 Consumer Expenditure Surveys summary on October 29, 2026. Table 1 reports $4,765 in average annual other vehicle expenses and $2,503 for gasoline and other fuels per consumer unit. Other vehicle expenses therefore exceeded fuel spending by $2,262. The first chart compares these two published averages.

Dividing $4,765 by $2,503 gives approximately 1.90. Put another way, other vehicle expenses were about 90% higher than spending on gasoline and other fuels in the 2025 survey averages. This is a ratio between spending categories, not a claim that costs rose 90% from a prior year.

Source data comparison

Other vehicle expenses versus gasoline and other fuels, 2025

Published source data
X-axis: Spending category
Y-axis: Average annual spending (USD)
Other vehicle expenses versus gasoline and other fuels, 2025. BLS Consumer Expenditure Surveys 2025, Table 1. National annual averages per consumer unit, not per vehicle or individual. Other vehicle expenses exclude net vehicle purchases.
CategoryUSD per consumer unit
Other vehicle expenses4,765 USD per consumer unit
Gasoline and other fuels2,503 USD per consumer unit

BLS Consumer Expenditure Surveys 2025, Table 1. National annual averages per consumer unit, not per vehicle or individual. Other vehicle expenses exclude net vehicle purchases.

The category called other vehicle expenses includes vehicle insurance, maintenance and repairs, vehicle finance charges, and vehicle rental, lease, license and other charges. It does not include the net outlay on vehicle purchases, which BLS lists separately. The gasoline and other fuels category includes diesel and electric-vehicle charging as well as gasoline, so the comparison is broader than gasoline alone.

The full transportation category averaged $13,492 in 2025. BLS breaks that into vehicle purchases (net outlay) of $5,023, other vehicle expenses of $4,765, gasoline and other fuels of $2,503, and public and other transportation of $1,199. The second chart shows all four categories. The component values sum to $13,490, $2 below the published total because the estimates are rounded.

A consumer unit is not necessarily one person or one household with a vehicle. BLS uses the term for people who share major expenses or individuals who manage expenses independently. These national averages include consumer units with different vehicle ownership, travel needs, incomes, and family sizes. They should not be treated as the cost of operating one particular car.

Source data comparison

Where the transportation budget went in 2025

Published source data
X-axis: Transportation category
Y-axis: Average annual spending (USD)
Where the transportation budget went in 2025. BLS Consumer Expenditure Surveys 2025, Table 1. Four categories total $13,490 versus the published $13,492 transportation total due to rounding. Vehicle purchases are net outlay.
CategoryUSD per consumer unit
Vehicle purchases (net)5,023 USD per consumer unit
Other vehicle expenses4,765 USD per consumer unit
Gasoline and other fuels2,503 USD per consumer unit
Public and other transit1,199 USD per consumer unit

BLS Consumer Expenditure Surveys 2025, Table 1. Four categories total $13,490 versus the published $13,492 transportation total due to rounding. Vehicle purchases are net outlay.

The 2025 figures also require a methodological caution. BLS changed the source survey for vehicle parts, accessories, and certain fluids in the 2025 annual release. BLS says that change affected the maintenance-and-repairs component and other vehicle expenses. This article compares categories within 2025 and does not claim that the 2024-to-2025 change in other vehicle expenses represents a real behavioral shift.

Data collection for the Consumer Expenditure Surveys was interrupted in October and November 2025 because of a lapse in federal appropriations. BLS applied weighting adjustments for the missing survey data and resumed collection in December. These are survey estimates, not an accounting of every family's expenses.

To reproduce the headline, subtract $2,503 from $4,765 to get $2,262, or divide $4,765 by $2,503 to get approximately 1.90. All values in both charts are from Table 1 of the 2025 BLS release. The BLS glossary and FAQ explain the category definitions and the 2025 methodology change.